
I’ve seen the future of cloud-native container monitoring — and what makes it modern is an idea from the past. Recently, as part of Cloud Field Day 5, I had the pleasure of being introduced to a fascinating system for monitoring and trouble-shooting cloud-native applications and the containers running them. And it’s from Sysdig.
But first, I can’t resist a bit of a rant. Whenever there is fundamental change in enterprise computing, the about-to-become legacy providers deal with the existential threats to their revenue streams by a) trying to convince users their legacy approaches are perfectly compatible with the impending change and b) rushing to produce “hybrid” or “bridge” products to get their installed bases to the new world. These attempts are comforting, of course, to the organizations that have invested in legacy technologies and to the people who have bet their technical vibrancy on them. But these accommodations are also compromises. Full stop. If you’ve been around enterprise computing for a decade or two — and you are honest with yourself — you’ll admit you’ve seen this movie before.
On the other hand, there are the early, “pure,” completely new technologies that eventually displace legacy thinking and products as the market transitions. Sysdig is one of these. It’s the first true cloud-native application monitoring and troubleshooting system I have seen for cloud-native apps and containers. Sysdig may have the early mover advantage — or it may be one of those products that’s too far ahead of its time. No matter, there are some product managers at application monitoring competitors who aren’t sleeping well. That’s because what Sysdig is doing is native to the cloud and, as the newbie in the category, it doesn’t need to genuflect to legacy concepts.
So, what’s got me gushing? It’s simple: Sysdig’s technical roots are in networking monitoring, specifically the much-loved Wireshark network monitor. As Sysdig noted in its presentation to #CFD5, if you capture packets, you know everything about the application. You know the networking connections; you know the files; you know performance; you know the databases. It may be a lot of data and it may be hard to get, but it’s complete and definitive. Network-as-plumbing also means network-as-source-for-all-app-monitoring data.
Unfortunately, that rich data stream for application monitoring and troubleshooting is not available in the cloud. Networking encryption and cloud provider virtualized networking are just two of the things that preclude the use of network level packet capture.
In spite of the cloud’s limitations on packet capture, Sysdig has found a way to capture much of what a network-style capture system can. It uses the extended Berkeley Packet Filter, a ring zero, kernel mode, raw interface coupled with a back-end analytical engine to achieve almost the same level of capture data a network capture would. The packet is dead; long live the packet!
Sysdig manages this, at least for Linux containerized apps, by coupling its collection container to a back-end analytical system. Others who saw the demo with me had various reactions to the back end’s GUI; I thought it was both nascent and perfectly presentable. YMMV.
But the back end UI isn’t what floats my boat. The real innovation is that Sysdig captures what you want to know now as well as what you don’t yet know you need. In a containerized infrastructure where everything is ephemeral, capturing every possible metric or action, storing it and allowing ex post facto inspection and analysis is a breakthrough. Think about it: a stateless microservice isn’t around long and, by design, leaves no footprints.
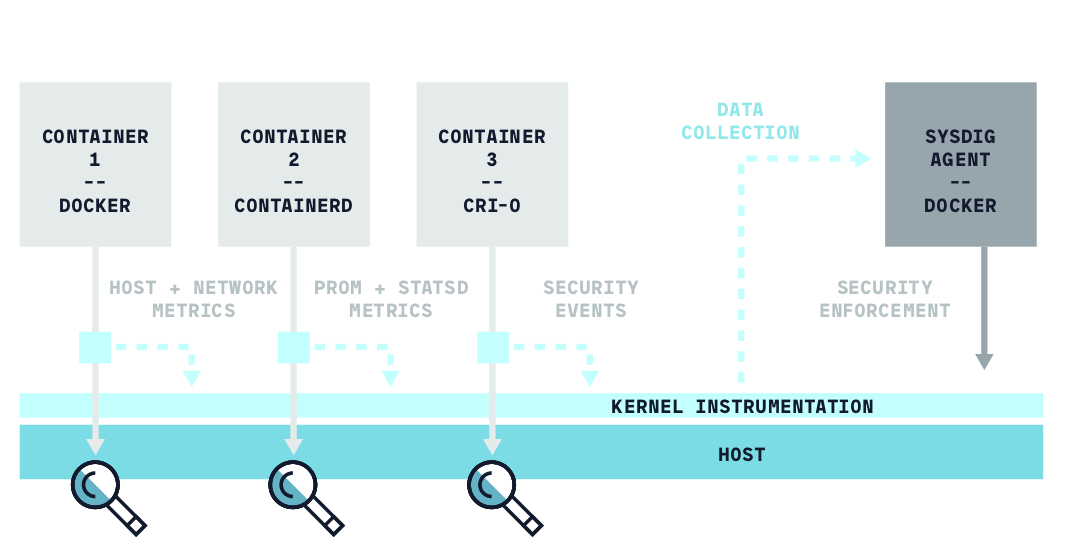
Here’s how Sysdig presents its high-level concept. In this illustration, containers report to Sysdig using eBPF and Sysdig is itself running in a container. Note how there’s zero additional packaging impact on a container, meaning that Sysdig can even discover rouge apps and/or application actions. It’s a self-discovering monitor.
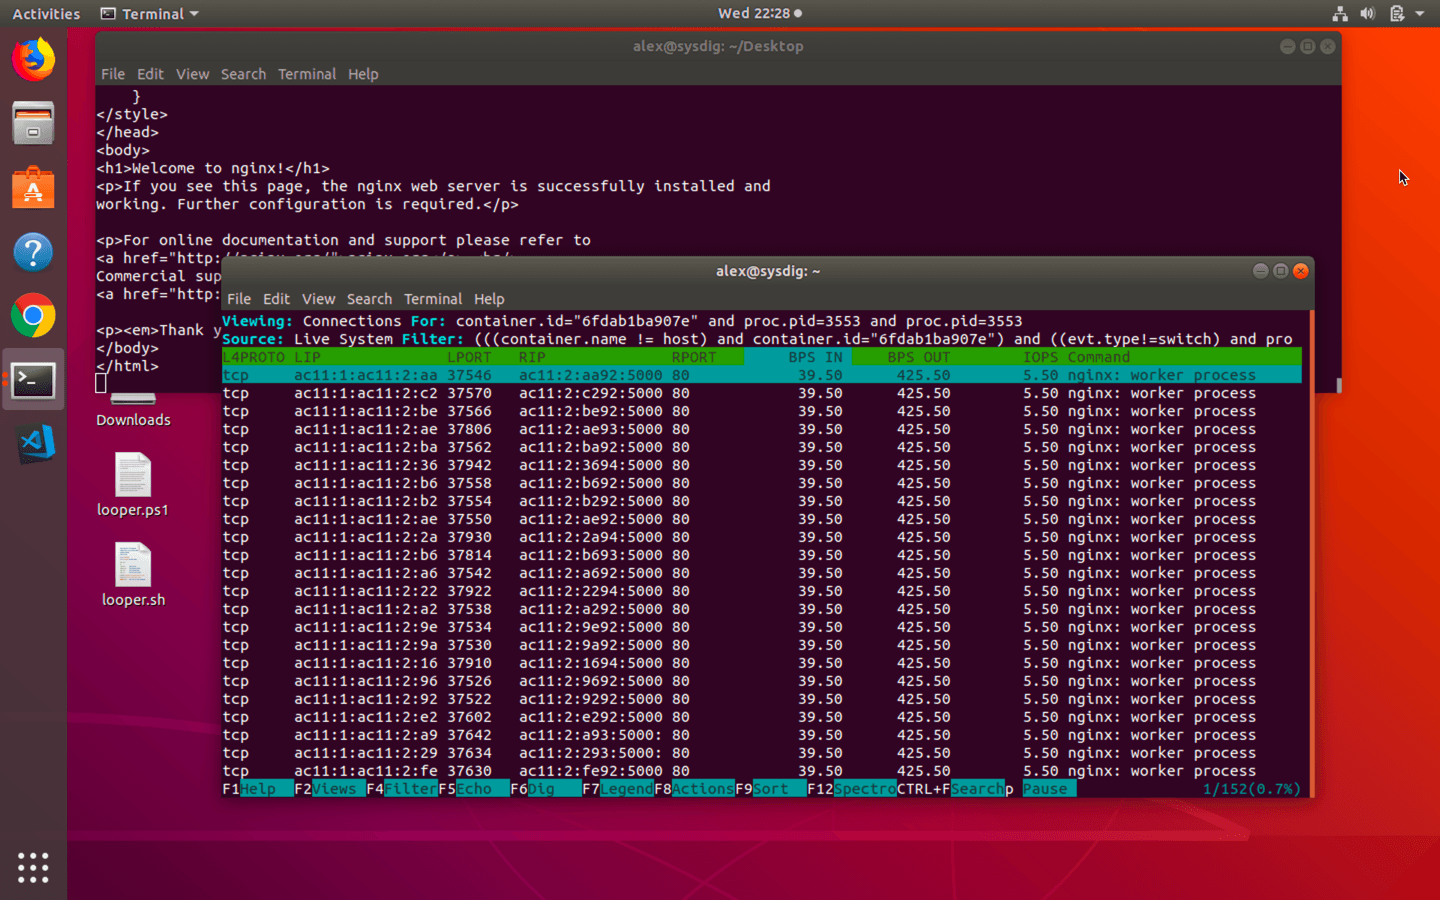
To get an idea of how flexible this is, I spent some time with the Sysdig open source version and its csysdig command line utility. In the screenshot below, I am running Nginx in a Docker container while an endless loop bash script does a curl to the container’s mapped HTTP port. You can see that Sysdig’s csysdig console app is able to look inside the container to show all the network connections (from all those curl commands) using the “filter” option.
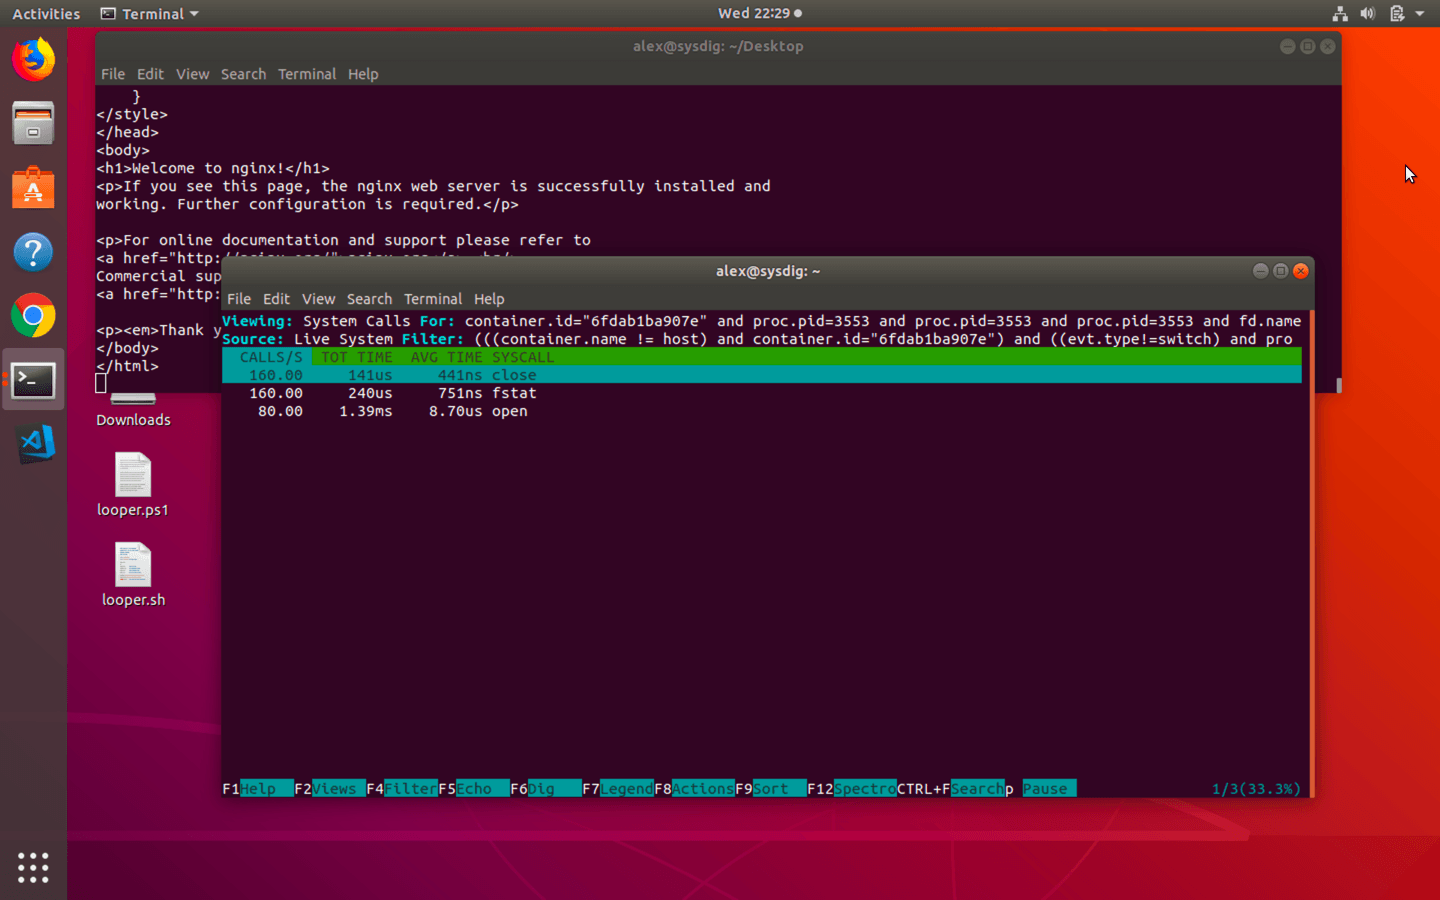
It’s a neat trick. But there’s more. csysdig can filter the filtered results and in the screenshot below, I used this drill-down feature to show the filesystem operations performed by a specific process.
Sysdig isn’t perfect, of course. Windows is a no-show (and that’s a shame given the progress Windows has made to integrate with Kubernetes). Some enterprises will resist because of the kernel mode eBPF — an objection that should be dismissed out of hand.
I’ve been working in enterprise IT long enough to, I hope, be able to differentiate truly novel ideas from rehashed ideas during major transitions. Sysdig is clearly the former. If you are moving to Linux containers, you should take a serious look at this cloud-native application monitoring platform.
Leave a Reply